Do you know your carriers' costs to handle your book of business? Without that knowledge, you can't have a fact based discussion about cost and how you can work together to reduce or lessen those costs to offset a portion and increase efficiencies. Ask the carrier for your operating ratio (OR) worksheets, so you can see the details about your account. An OR is a measure of carrier efficiency, operating expenses/operating revenue X 100. An operating ratio of 100 means carrier breaks even. Under100 means carrier profitability. Over 100 means carrier loss.
Expenses = $100,000
Revenues = $110,000
Operation Ratio 90.9
$100,000/$110,000 X 100 = 90.9
You should know 3 benchmarks when it comes to how carriers look at customer profitability
1. Where the variable cost level is. At what point am I not even covering my variable or out of pocket cost and
what is the variable cost as a percent of revenue?
2. What is my breakeven point from a contribution standpoint? This is where the company is getting SOME contribution from an account, but not enough, based on the volume of business to cover fixed cost and overhead.
3. At what level of contribution is an account profitable? At what point do I know I have covered my variable and fixed cost and I am making money on an account.
In the trucking industry, fixed costs generally comprise 25-30% of each revenue dollar and variable costs cover 60 to 70% of each revenue dollar, yet the primary concern on the LTL terminal P&L statement seems to be the proper allocation of fixed cost to revenue. Go figure!
Understanding how carriers make money will help you understand how to negotiate with your carrier to create a strategic relationship.
The industry faces challenges like never before. Stricter/new regulations, old-school and outmoded pricing approaches and swings in the balance of power back and forth from the shipper to the carrier, create a paradigm shift in how companies approach NMFC pricing. These forces can no longer be ignored. Shippers and carriers must come together and address the real problem of how to optimize overall carriers' efficiencies. If you don't ask you don't get.
While the process for establishing pricing between buyers and suppliers is broken, both parties now have an opportunity to benefit by increasing efficiencies. At the heart of the present misalignment is the fact that predictable sourcing business models typically result in the buyer company and their supplier establishing a "Rate" that reflects the conditions at a point in time when the business agreement is created.
A "Rate" is not responsive to changes in the scope of work, in the market, or in corporate strategy. In addition, many companies do not take the time to use more forward-looking sourcing business models and pricing mechanisms that are designed to keep a buyer and supplier relationship in equilibrium as "business happens in real time."
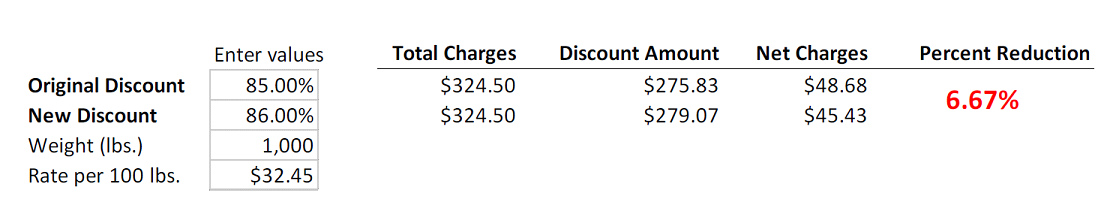
One of the best ORs presently in the LTL market is Old Dominion with an OR of 85. For every dollar generated Old Dominion has a 15% return. Most LTL carriers are in the mid 90% for OR. This figure is calculated based on all the pricing for all shipments and how they "Fit" into the carriers lane balance.
In a previous article, we noted that "reviewing your Pricing and Rules tariffs and studying your historical shipping patterns, it will become apparent that your carrier's lanes are not well-aligned with their network strengths, liability and cost to serve. The UPS Hundredweight and FedEx Mulityweight shipments 500 pounds or less now have a new price-liability LTL competitor.
"There is frequently a significant cost-savings opportunity because carriers' pricing reflects the fact they are crosssubsidizing profitable and unprofitable lanes for any given customer. Essentially the carrier's pricing reflects the need to rob Peter to pay Paul, so the shipper doesn't get the best pricing nor does the carrier make an acceptable overall Profit margin. One Discount and one Release Value and a FAK for all your book of business just simply does not work for you or your carrier.
On discovering this opportunity, ask your carrier to: Jointly evaluate how the distributions of shipments by lane inbound and outbound release value could be re -aligned by tailoring shipments to each carrier's network strengths, thus lowering their cost to serve, and lowering the price to shipper. "
If the carrier handled 10 shipments for a day all 10 could potentially generate an 85 OR. What happens is that 9 shipments operate at an 85 OR, the tenth shipment OR is 130; the OR is now considerable higher, with less bottom line profit for the carrier.
Talk with the carrier and do not ship that shipment with a 130 OR. See what can be done to improve this shipment OR. The carrier will view your account as an excellent profit maker if you don't let them handle marginal or unprofitable freight.
What can be done to make this shipment more profitable for the carrier? Send your suggestions and I will send you a free discount comparison application.
Bill Pugh (Formerly, Executive Director - National Motor Freight Traffic Association, Inc.) and Hank Mullen each have over
40 years of experience and are here to help. We're fanatical about seeing you be successful. If you have any questions or
would like any more information, please give us a call at 770-380-1650 or 703-624-4240. Email
Hank.Mullen@dynarates.com or Bill.pugh@dynarates.com. We are located in Atlanta Georgia
Expenses = $100,000
Revenues = $110,000
Operation Ratio 90.9
$100,000/$110,000 X 100 = 90.9
You should know 3 benchmarks when it comes to how carriers look at customer profitability
1. Where the variable cost level is. At what point am I not even covering my variable or out of pocket cost and
what is the variable cost as a percent of revenue?
2. What is my breakeven point from a contribution standpoint? This is where the company is getting SOME contribution from an account, but not enough, based on the volume of business to cover fixed cost and overhead.
3. At what level of contribution is an account profitable? At what point do I know I have covered my variable and fixed cost and I am making money on an account.
In the trucking industry, fixed costs generally comprise 25-30% of each revenue dollar and variable costs cover 60 to 70% of each revenue dollar, yet the primary concern on the LTL terminal P&L statement seems to be the proper allocation of fixed cost to revenue. Go figure!
Understanding how carriers make money will help you understand how to negotiate with your carrier to create a strategic relationship.
The industry faces challenges like never before. Stricter/new regulations, old-school and outmoded pricing approaches and swings in the balance of power back and forth from the shipper to the carrier, create a paradigm shift in how companies approach NMFC pricing. These forces can no longer be ignored. Shippers and carriers must come together and address the real problem of how to optimize overall carriers' efficiencies. If you don't ask you don't get.
While the process for establishing pricing between buyers and suppliers is broken, both parties now have an opportunity to benefit by increasing efficiencies. At the heart of the present misalignment is the fact that predictable sourcing business models typically result in the buyer company and their supplier establishing a "Rate" that reflects the conditions at a point in time when the business agreement is created.
A "Rate" is not responsive to changes in the scope of work, in the market, or in corporate strategy. In addition, many companies do not take the time to use more forward-looking sourcing business models and pricing mechanisms that are designed to keep a buyer and supplier relationship in equilibrium as "business happens in real time."
One of the best ORs presently in the LTL market is Old Dominion with an OR of 85. For every dollar generated Old Dominion has a 15% return. Most LTL carriers are in the mid 90% for OR. This figure is calculated based on all the pricing for all shipments and how they "Fit" into the carriers lane balance.
In a previous article, we noted that "reviewing your Pricing and Rules tariffs and studying your historical shipping patterns, it will become apparent that your carrier's lanes are not well-aligned with their network strengths, liability and cost to serve. The UPS Hundredweight and FedEx Mulityweight shipments 500 pounds or less now have a new price-liability LTL competitor.
"There is frequently a significant cost-savings opportunity because carriers' pricing reflects the fact they are crosssubsidizing profitable and unprofitable lanes for any given customer. Essentially the carrier's pricing reflects the need to rob Peter to pay Paul, so the shipper doesn't get the best pricing nor does the carrier make an acceptable overall Profit margin. One Discount and one Release Value and a FAK for all your book of business just simply does not work for you or your carrier.
On discovering this opportunity, ask your carrier to: Jointly evaluate how the distributions of shipments by lane inbound and outbound release value could be re -aligned by tailoring shipments to each carrier's network strengths, thus lowering their cost to serve, and lowering the price to shipper. "
If the carrier handled 10 shipments for a day all 10 could potentially generate an 85 OR. What happens is that 9 shipments operate at an 85 OR, the tenth shipment OR is 130; the OR is now considerable higher, with less bottom line profit for the carrier.
Talk with the carrier and do not ship that shipment with a 130 OR. See what can be done to improve this shipment OR. The carrier will view your account as an excellent profit maker if you don't let them handle marginal or unprofitable freight.
What can be done to make this shipment more profitable for the carrier? Send your suggestions and I will send you a free discount comparison application.
Bill Pugh (Formerly, Executive Director - National Motor Freight Traffic Association, Inc.) and Hank Mullen each have over
40 years of experience and are here to help. We're fanatical about seeing you be successful. If you have any questions or
would like any more information, please give us a call at 770-380-1650 or 703-624-4240. Email
Hank.Mullen@dynarates.com or Bill.pugh@dynarates.com. We are located in Atlanta Georgia